Integrated Scorecards and Measurables
Make your vision measurable with a simple, modern approach
✓ No credit card required ✓ 30-day free trial ✓ Setup in minutes
Disconnected data costs more than stress - it eats time and money.
The Problem
You and your team can’t see what's really happening even with a army of tools
Teams drown in detail but can’t see what matters most
Numbers are always outdated
Numbers don't drive decisions
The Solution
Results are measurable
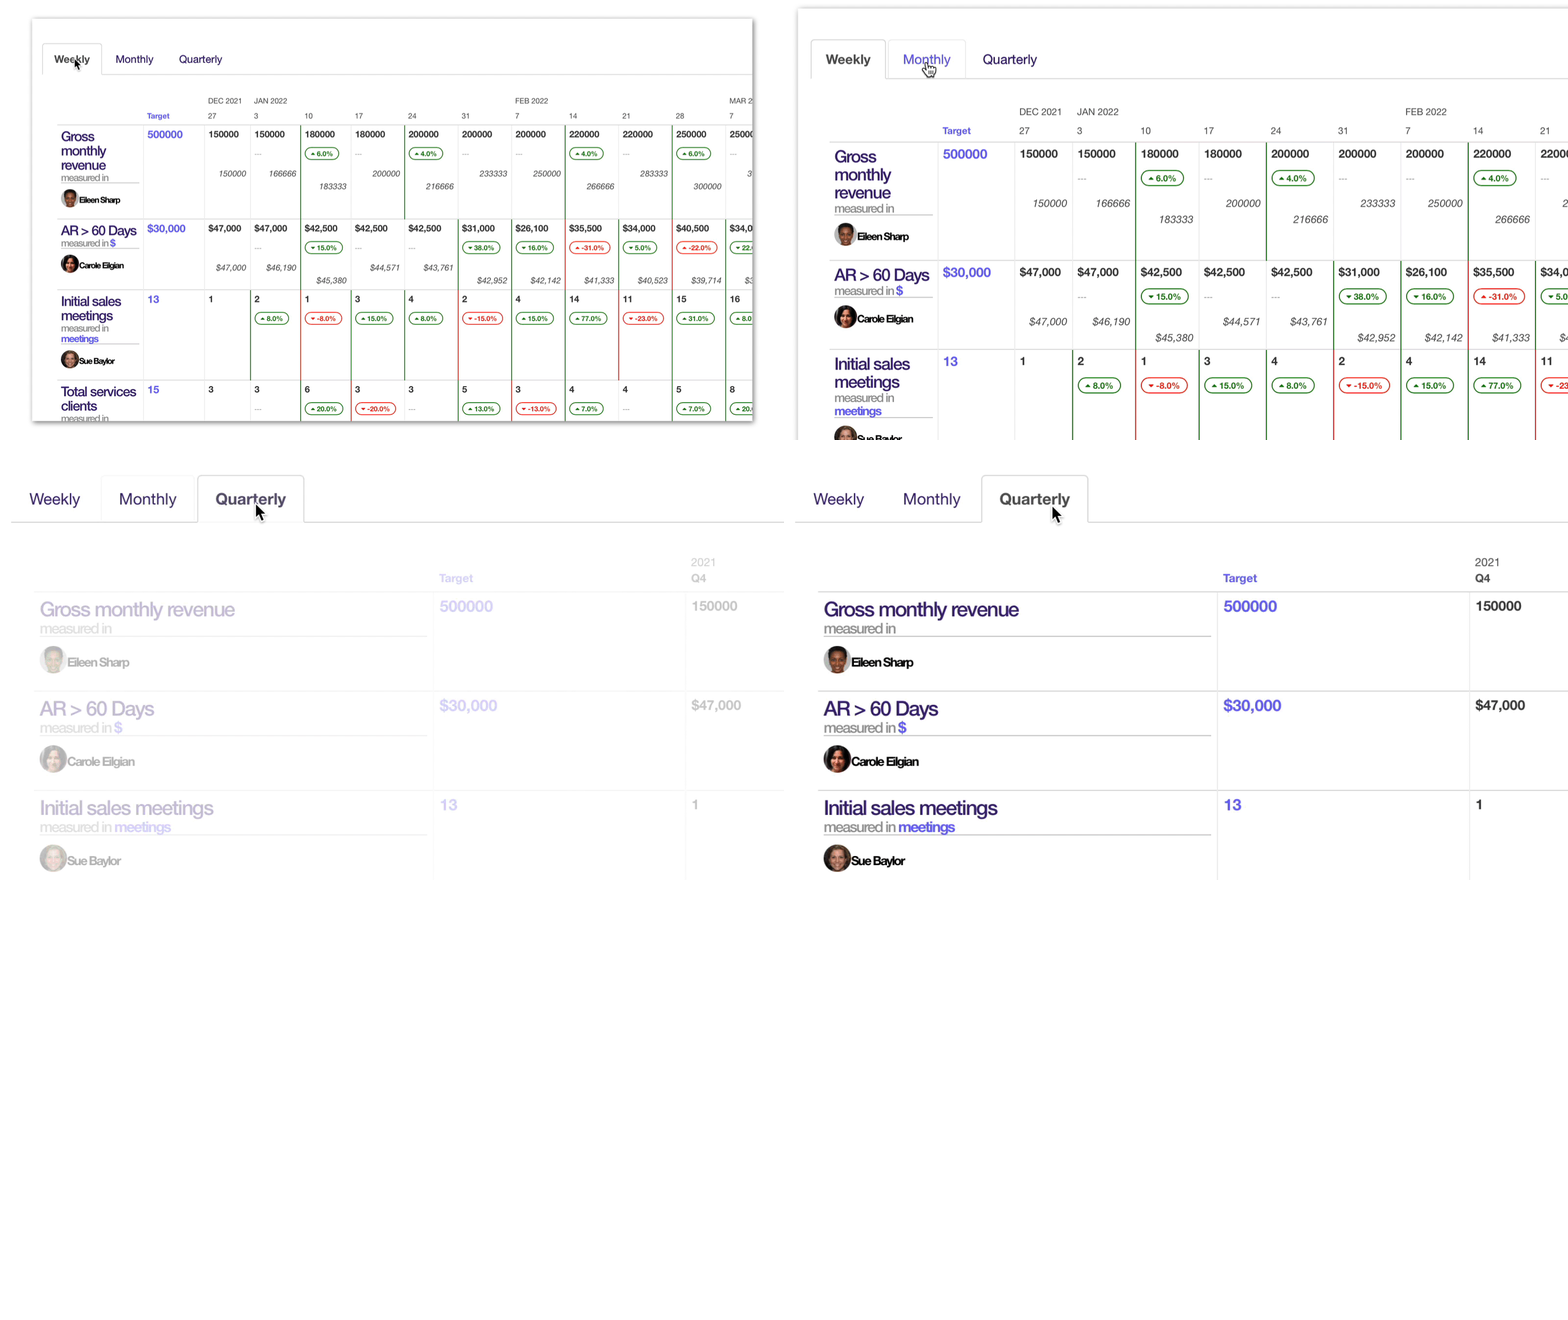
Simple scorecards everyone can see
Integrations and guidance keep data fresh
Automatically integrated in every business process
Make Results Measurable So Everyone Understands Success
ResultMaps guides you through a quick map of your business process to produce numbers that create results
Everyone knows their numbers and how they impact overall results (better decisions, less micromanagement)
Multiple visualizations show health at a glance
Simple Scorecards Everyone Can See
Instant result focus for everyone: integrated with your systems, cascaded up and down
Roll up measurables - parent scorecards automatically aggregate child scorecards
Generate reports instantly with one click
Integrations and Guidance to Keep Data Up to Date
Connect via webhooks, automations, or use guided entry when you need human review
Webhook API for live data (competitors require manual entry)
When manual review matters, guided updaters prompt the right person at the right time
Scorecards Integrated with Every Business Process
Scorecards populate L10 meetings, show up in 1:1s, surface in each person’s Personal Command Center
Weekly L10s start with current scorecards - no copying, no outdated spreadsheets
Each measurable has one directly responsible individual
Auto populate on individual profiles, Ownership and Accountability Chart seats.
Common Questions
Will this work with existing tools?
Yes - connects via webhook API to Salesforce, HubSpot, Stripe, or any API. Your data stays in your tools, ResultMaps pulls it automatically.
Does it work with the Entrepreneurial Operating System (EOS)?
Built for EOS - scorecards populate your L10 meetings automatically, support your Rocks, and maintain the accountability chart. ResultMaps digitizes EOS without changing it.
What's the difference between this and KPIs?
KPIs are what you measure. Integrated Scorecards are HOW you measure and WHERE they show up. Your KPIs flow into meetings, 1:1s, and daily workflows automatically.
Are these updated manually or automatically?
Your choice - webhook API for automatic updates, guided entry when you need human review. The system prompts the right person at the right time.


