Org Charts with Ownership and Accountability
How To Get Engaged Accountability and Ownership
(Without Stress or Wasted Time)
Empower your team with clarity using ResultMaps integrated tools, proven playbooks and frameworks to drive results 2x faster at 1/2 the cost.
Trusted by Innovative Entrepreneurial Growth Companies To Accelerate Results.
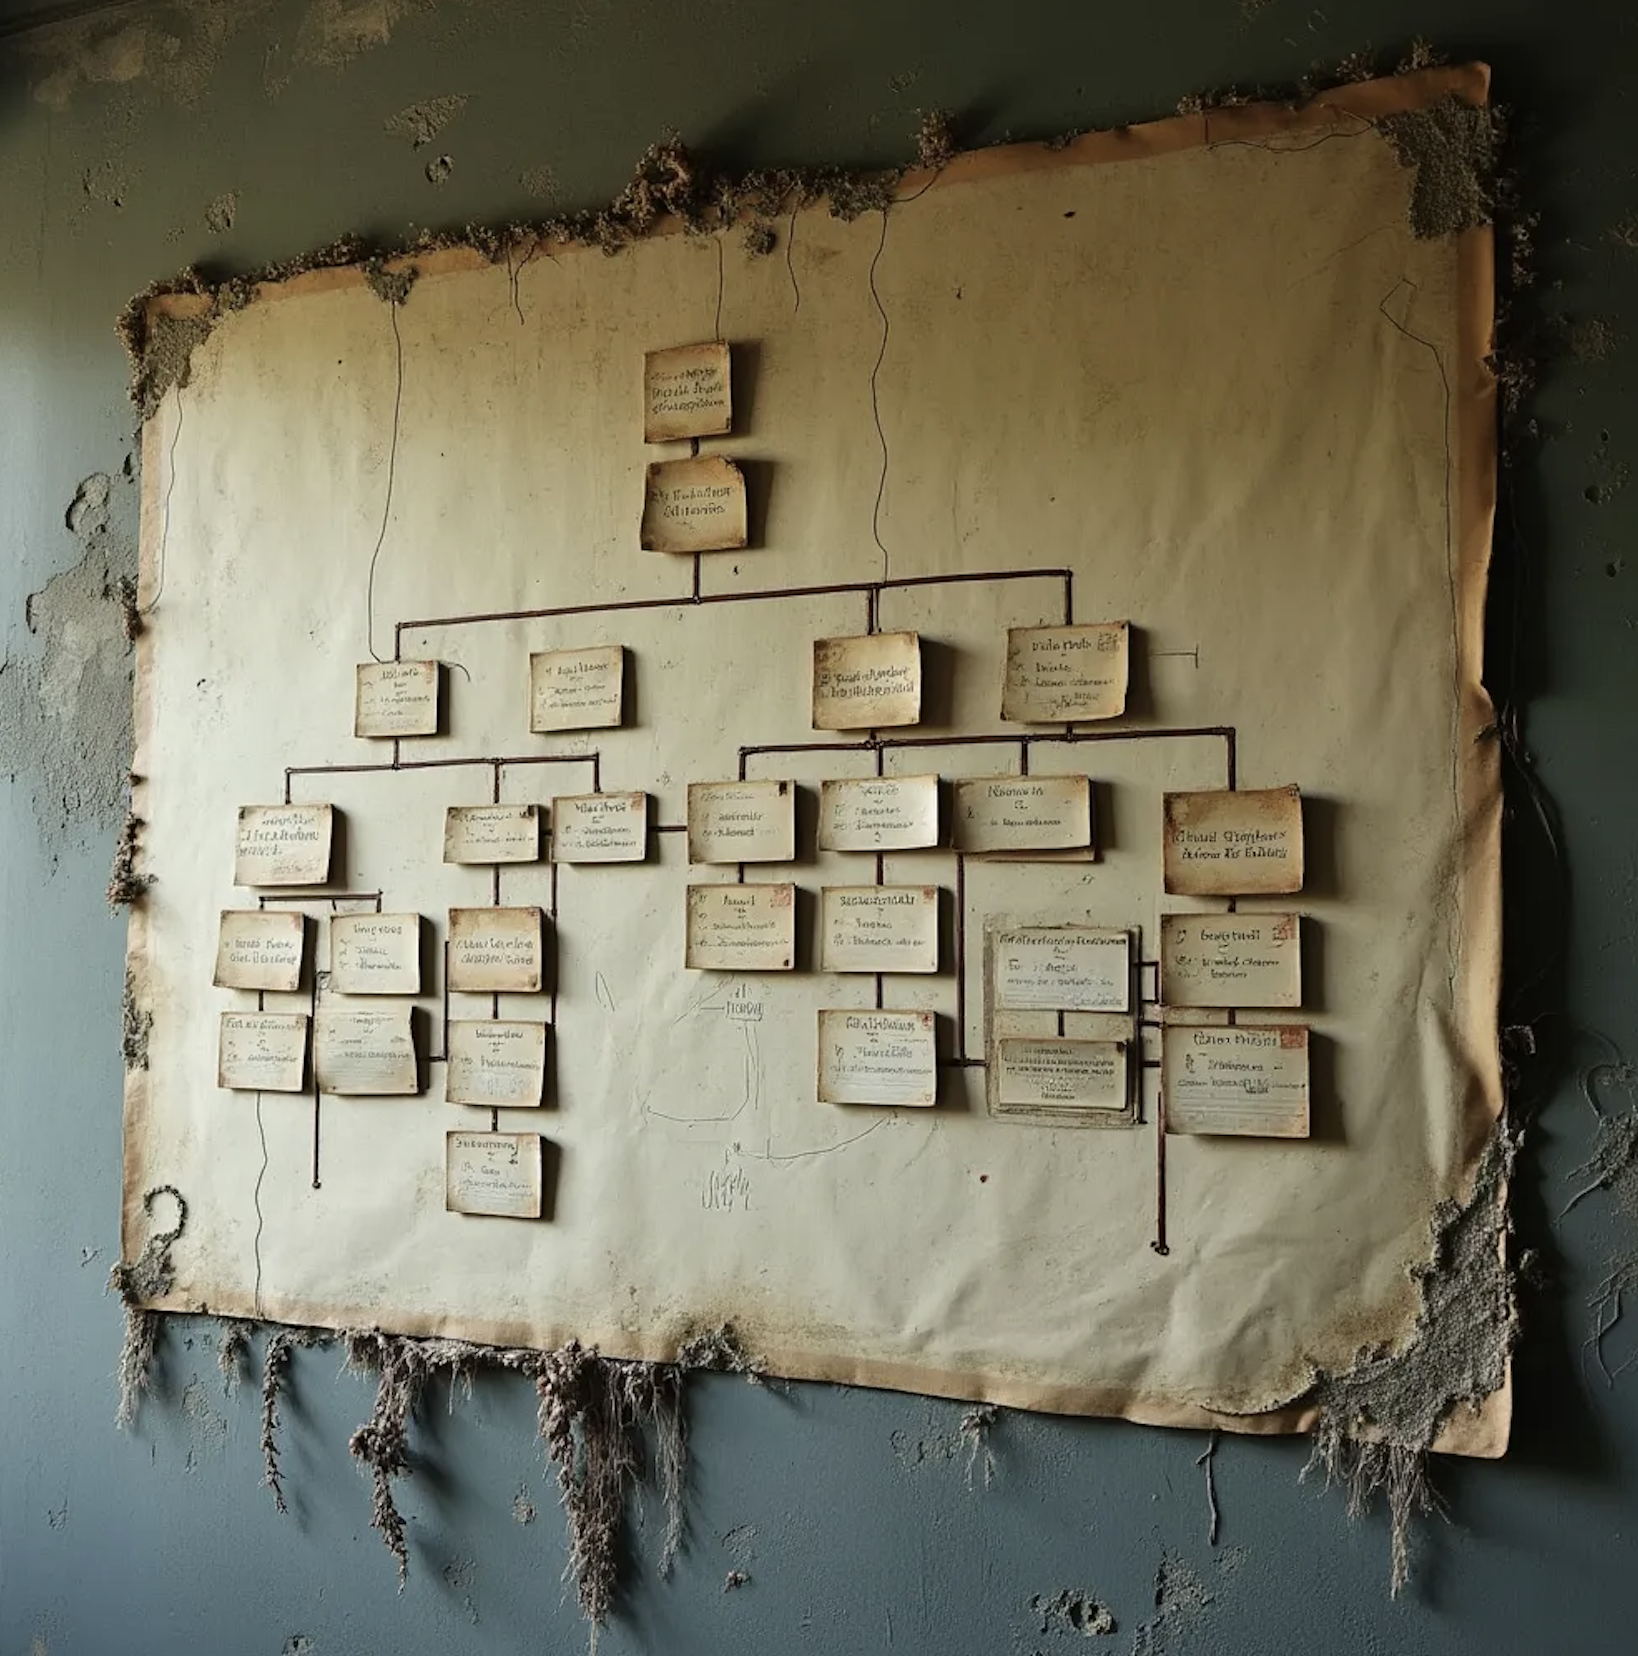
Honestly Now, Honestly Now, Is This The Way To Create Clarity In Your Company?
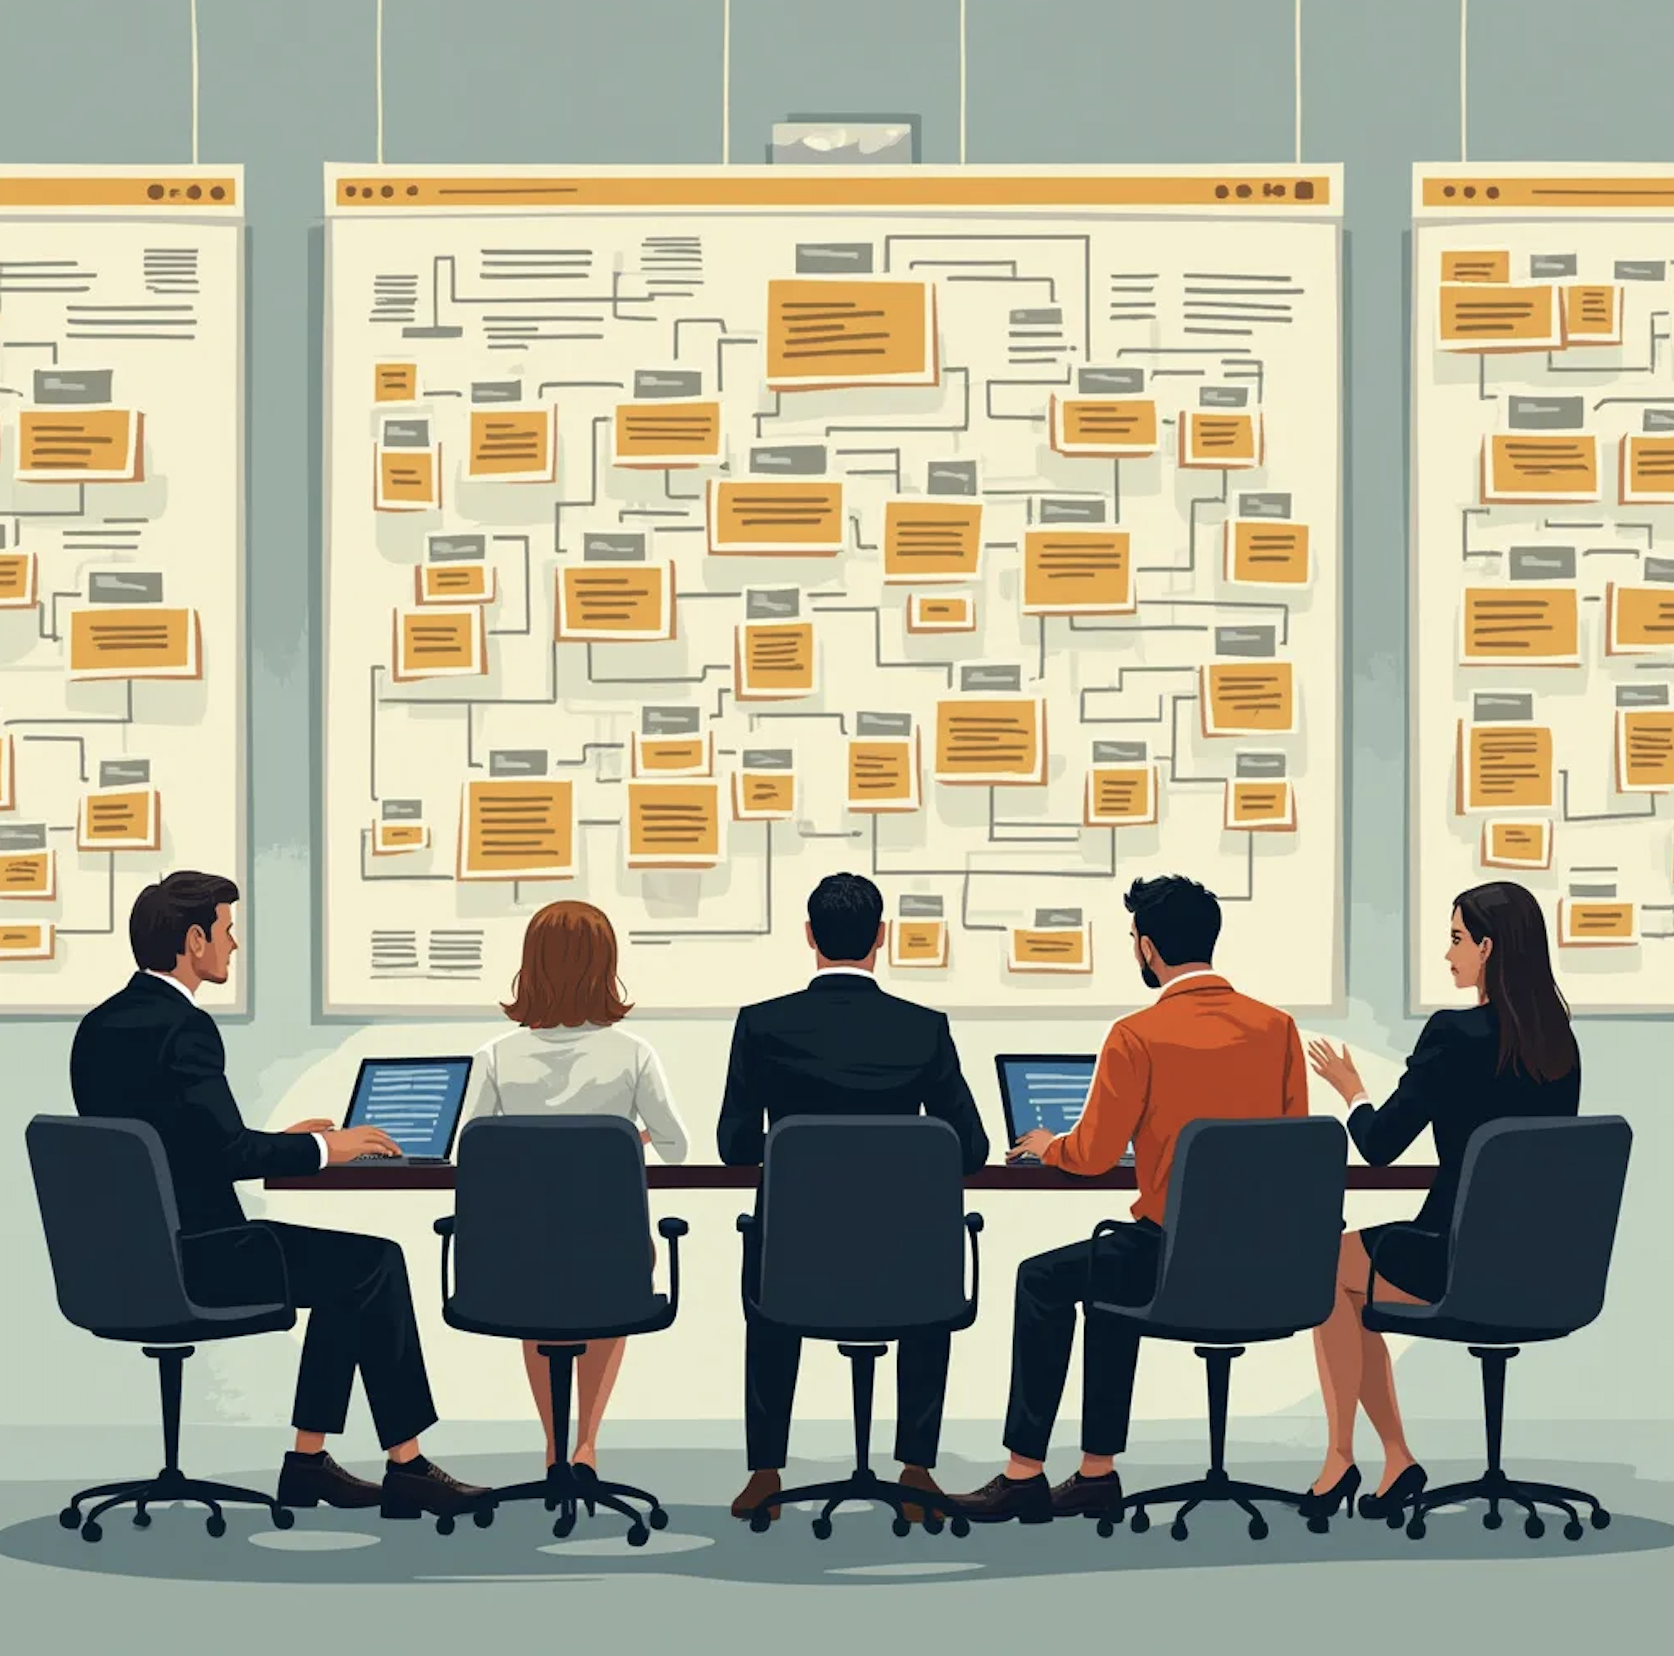
Traditional org charts fail to bridge the gap between vision and day-to-day operations. They create silos, muddy accountability, and break the trust equation of time + consistency. Your teams struggle with:
Unclear roles and responsibilities, leading to confusion and missed deliverables
No clear connection between your organization chart and your day-to-day operations, causing misaligned efforts and wasted resources
Slow decision-making due to ambiguous authority and ownership
Lack of visibility into how individual roles contribute to overall company goals
People are confused by shifting responsibilities and accountability
Responsibilities fall into cracks between roles with no clear ownership
Unclear ownership of critical processes with no single accountable individual
Why Traditional Approaches The Org Chart Are Holding You Back
Unclear roles and responsibilities, because charts are just names and titles, leading to confusion and missed deliverables
No clear connection between your organization chart and your day-to-day operations, causing misaligned efforts and wasted resources
Slow decision-making due to ambiguous authority and ownership
Lack of visibility into how individual roles contribute to overall company goals
Confusion as because people struggle to follow the reasoning for shifts in responsibilities and accountability
Misses as responsibilities fall into cracks between roles
Unclear ownership of processes
Inability to adapt when situations change, because no one has time to update the slides or tools
8 Hidden Flaws in Popular Org Chart Tools
Expired data traps: Most solutions require time-consuming manual updates, leading to outdated information and communication delays in fast-changing environments.
Data disconnection: Typical org chart tools fail to link roles with ownership of goals, processes, or performance data, missing crucial context for decision-making.
Limited integration: Many solutions don't seamlessly integrate with other business tools, creating silos and hindering a holistic view of the organization.
Static visualization: Traditional software often produces static diagrams that don't adapt to different contexts (teams, or one leader for example) or provide insights for decisions, meetings and reports.
Narrow focus: Most tools concentrate solely on hierarchy, neglecting the dynamic nature of modern organizations and failing to support agile decision-making.
Inconsistent reinforcement: Current solutions rarely provide mechanisms to consistently reinforce accountability and ownership over time.
Limited utility: Many org chart tools are viewed as HR-only resources, failing to inform action or growth beyond hiring and basic "reporting structure".
Growth planning miss: Most org chart tools fail to provide insights to help leaders assess where to grow or consolidate headcount, leaving strategic workforce planning disconnected from organizational structure.
“80% of employees cite keeping focus during continual shifts as their critical challenge, hindering adaptability and growth.”
The Costs of Toxic Org Charts
Employee disengagement: 80% of employees are not highly engaged, often due to lack of clear direction and understanding of their role in the bigger picture.
Strategy execution failures: 90% of companies fail to execute their strategies successfully, frequently due to misalignment between organizational structure and strategic goals.
Increased turnover: Lack of clear roles and growth paths can lead to higher employee turnover, costing 50% to 200% of an employee's salary to replace them.
Misaligned priorities: A study in the Harvard Business Review found "unclear values and conflicting priorities" to be the number 1 reason strategy execution fails.
Widespread confusion: 75% of employees don't understand their leader's direction, leading to misaligned efforts and wasted resources.
Widespread burnout: 4 out of 5 people report burnout
ResultMaps Transforms Your Org Chart Into Real World Accountability, Ownership and Engagement In 3 Steps
Why it's better: Unlike static org charts, ResultMaps ownership and accountability charts are living and growing, fully integrated with your operations. The structure provides complete clarity. That means decision making and improvement become simple and fast.
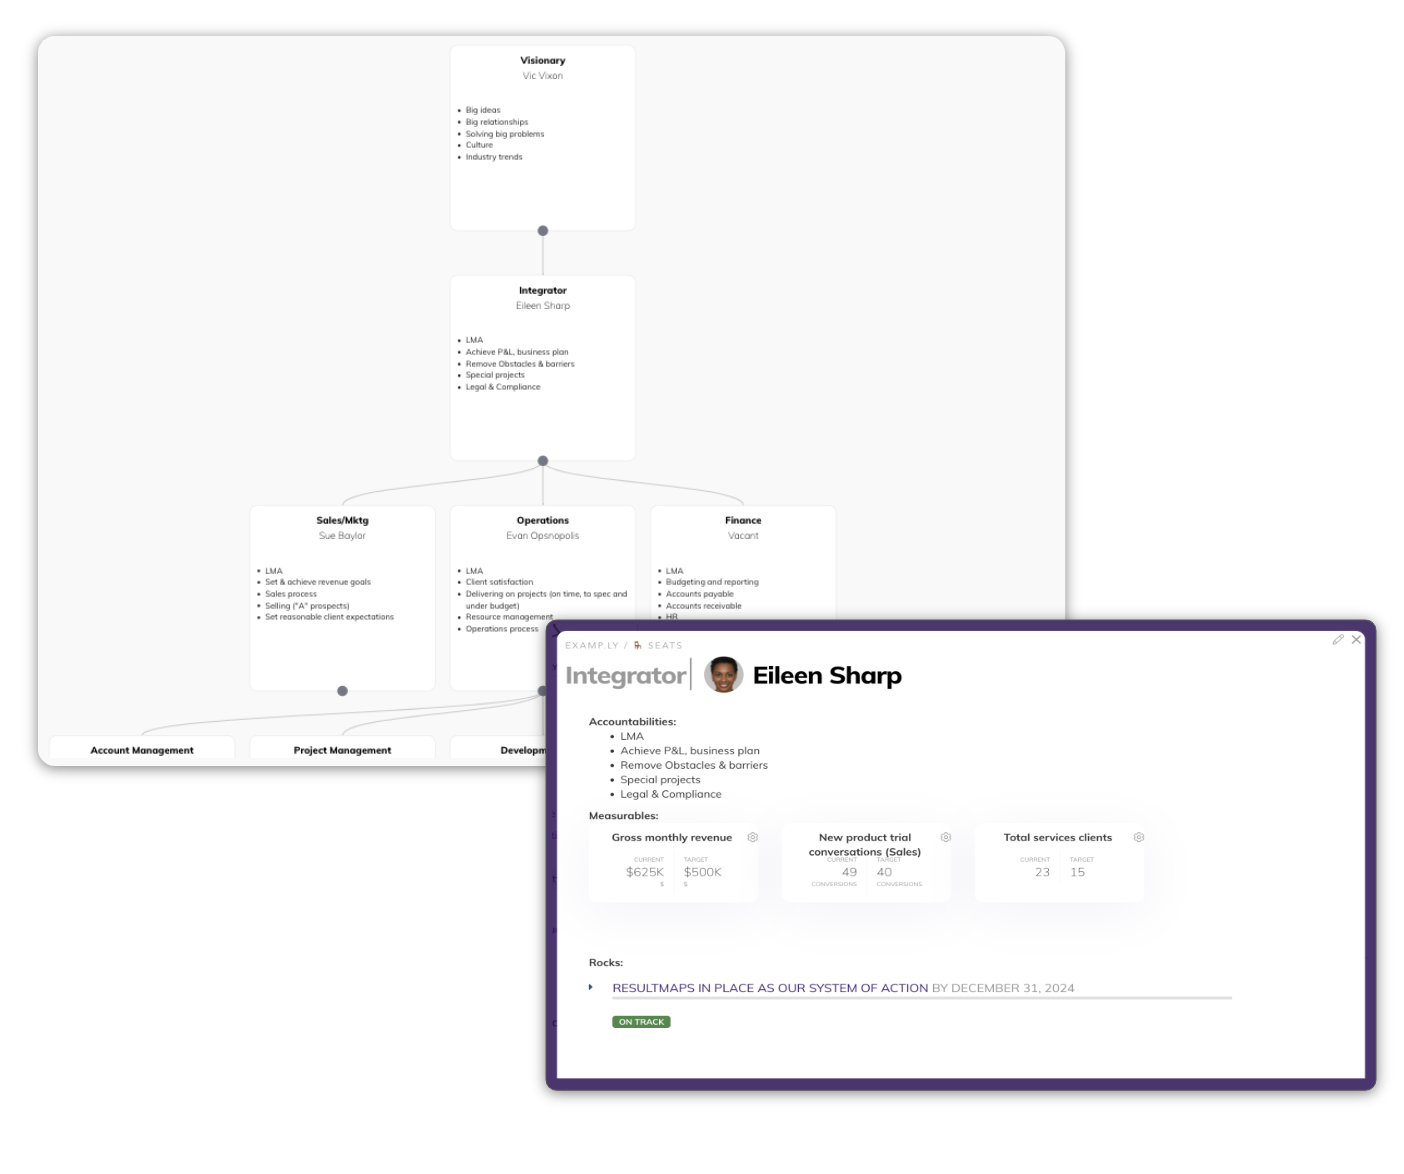
Step 1. Create functional seats to capture ownership and accountability without losing connection with day-to-day workplace reality
Use intuitive, interactive charts that integate with your business operating system to convey accountability and ownership in simple terms, without creating confusion or ignoring realities of everyday work
Easy zoom in or zoom out to switch context as needed, without wasting time to get the full picture
Clarify decision and process ownership for each seat so you empower action, without losing alignment
Connect roles to core processes so you streamline operations, without things slipping into cracks between roles
1-click access to integrated details and data from other parts of ResultMaps, so you see the full picture without wasting time chasing down data
Playbooks and cheatsheets make sure you are set up for success without creating something complicated.
Make it clear where someone sits in 2 seats without adding ambiguity or confusion, so you can see where reward extra effort or add headcount as you grow
Step 2. Provide specifics on measurables ("KPIs"), targets (rocks, OKRs, etc.) and processes so you drive results without losing focus or setting unrealistic expectations
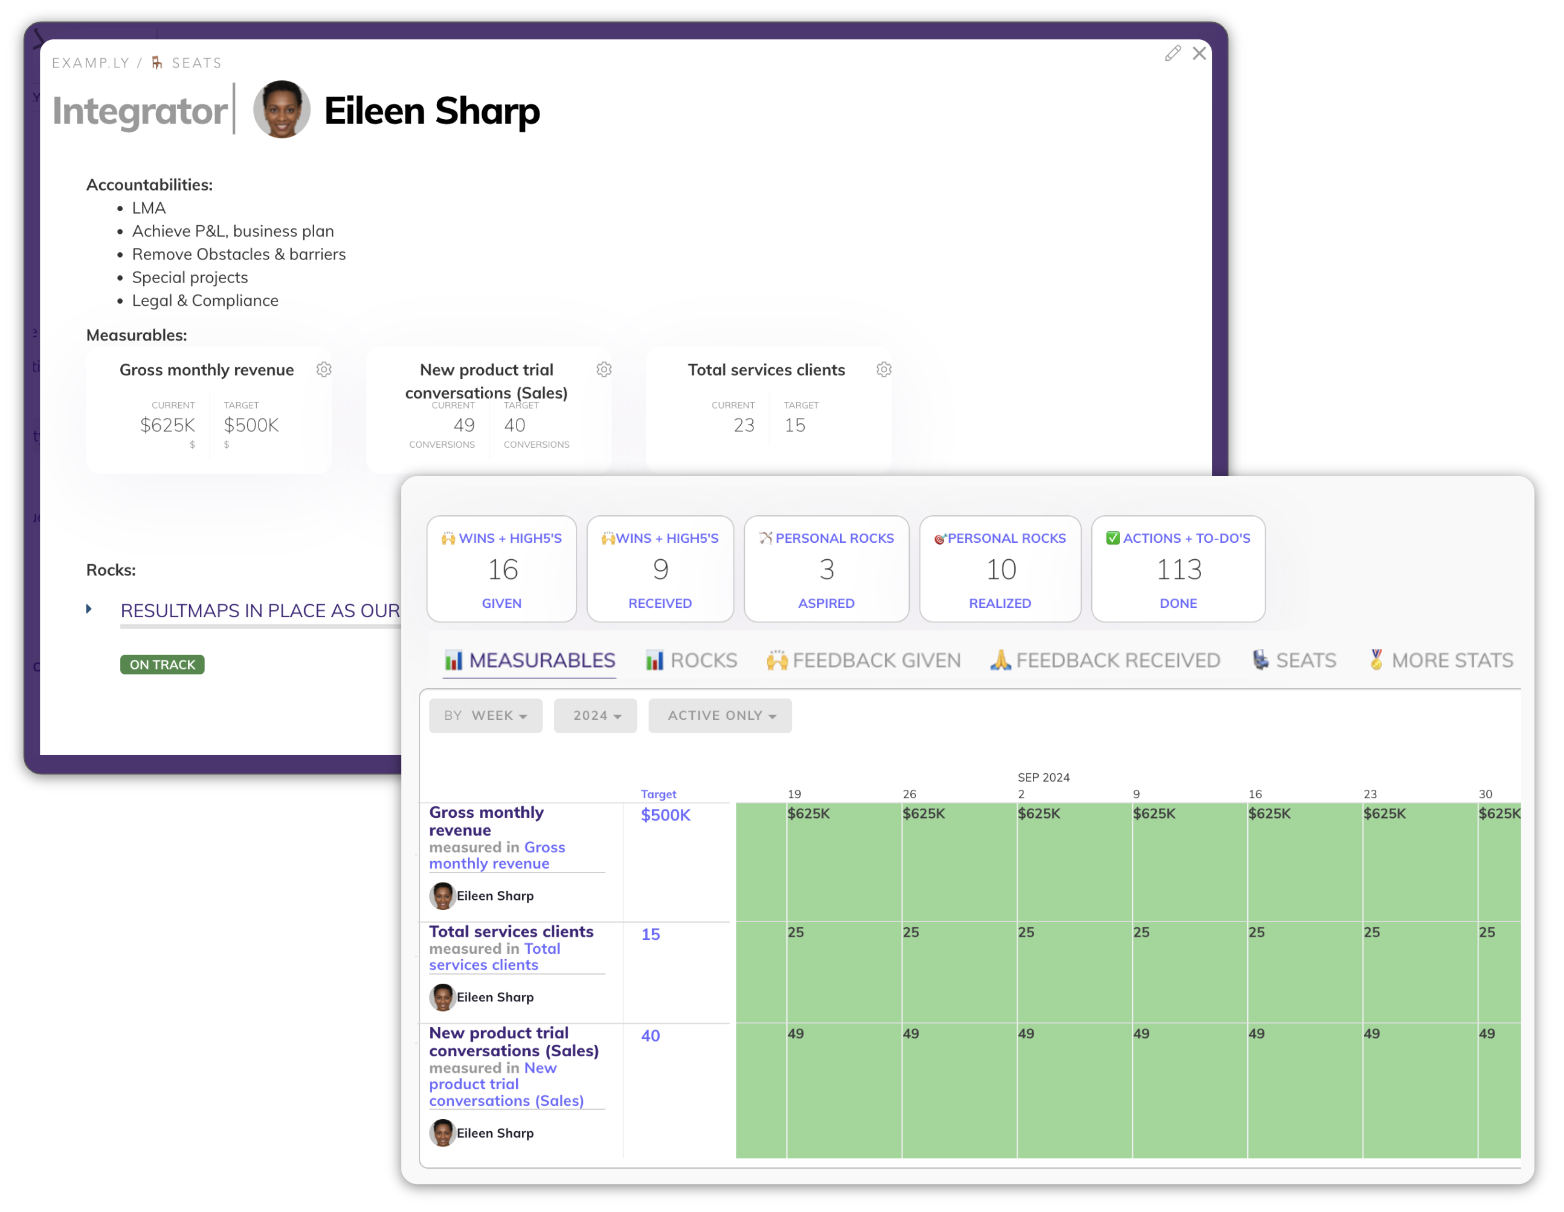
Connect measurables / KPIs directly to each seat so you track both accountability and performance without losing sight of outcomes.
Connect targets (rocks or OKRs) directly to seats so you align goals across the organization, without disconnecting strategy from execution
1-click through to integrated real-time data by seat owner, so you have the latest information, without chasing down manual updates.
Why it's better: ResultMaps goes beyond simple performance tracking by directly linking measurables and targets to specific seats in your organization. This connection ensures that every KPI and goal is tied to clear ownership, promoting accountability and allowing you to see how individual performance contributes to overall company objectives in real-time.
Why it's better: ResultMaps Ownership and Accountability Charts snap in to your operating rhythms. The clarity they create is a click away and embedded in your meeting agendas and processes.
Step 3. Track progress, course correct, and celebrate wins, so that you keep your team motivated, growing and on track without micromanaging or wasting time.
Print ownership and accountability charts for quarterly reviews so you align long-term goals with organizational structure, without disconnecting strategy from day-to-day operations
Generate automated reports based on accountability charts so you track progress over time, without manual data compilation
See seat ownership in each team member's profile, along side so you can quickly understand where responsibilities are creeping up or how performance is improving
Quick access to accountability and ownership charts from meetings and dashboards, so you can reference them for context from your 1:1s and other meetings, without wasting time
This Is Why Customers Love ResultMaps
These Companies Are Already Seeing Results -
When Will You Join Them?
Book a FREE demo and see how ResultMaps can 2x your speed and cut your costs in half.


